Graham Harris, Department of Primary Industries and Fisheries/Cotton Catchment Communities CRC
The Cotton Catchments Communities CRC through the Rural Water Use Efficiency Initiative (funded by NRW) has been collaborating with T-Systems Australia since the 2000/01 season on three drip irrigation demonstration sites. These drip irrigation demonstrations have been run in cooperation with three irrigators:
- Paul McVeigh at ‘Loch Eaton’, Dalby
- Ian Hayllor, ‘Kenisington Park’, Dalby
- Scott Seis, ‘Mungana Farms’, Macalister
‘Loch Eaton’ drip irrigation demonstration
This demonstration was conducted in cotton on a heavy black cracking clay in the 2000-01, 2001-02 and 2002-03 seasons. This demonstration compared sub-surface drip irrigation (SDI) using TSX 1115-40-250 T-Tape buried at 300mm and lateral spacings of 1m and 2m with furrow irrigation. In the 1m lateral spacings the tape was placed directly below each plant row. In the 2m lateral spacings the tape was positioned midway between alternate pairs of plant rows. The two SDI treatments were laterals buried at 1 metre centres (directly below the plant row) and laterals at 2m spacings between every second cotton rows. The field was 550m in length and the cotton was planted on beds.
Neutron probes and C-Probes were used to monitor soil moisture levels. Flow meters were used to measure applied water in all treatments. The furrow irrigation system was optimised using the Irrimate advance sensors.
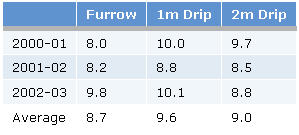
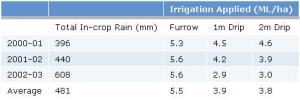
The results are summarised in Tables 1 and 2.
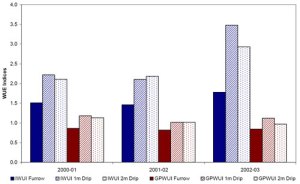
The relative performance of the cotton crops grown with irrigation system is summarised in Figure 1.
Over three years, the average yield increase for drip irrigated over furrow irrigated cotton was 10% with the 1m drip tape and 3% with the 2m drip tape. The average reduction in applied irrigation for drip irrigated over furrow irrigated cotton was 29% with the 1m drip and 31% with the 2m drip. It is of note that the yield increase in the first year with drip was not repeated in subsequent years.
The improvement in water use efficiency of drip compared to furrow irrigation is shown by the IWUI which is 65% greater (2.60 bales/ML) and the GPWUI which is 32% greater (1.11 bales/ML) for 1m drip compared to furrow. For the 2m drip the increases were 53% (2.41 bales/ML) and 24% (1.04 bales/ML) respectively.
‘Kensington Park’ drip irrigation demonstration
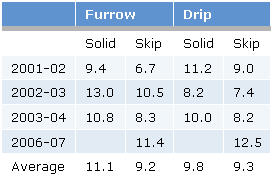
This cotton demonstration was established in cotton on a heavy black cracking clay in the 2001-02, 2002-03, 2003-04 and 2006-07 seasons. This demonstration compared two non-permanent drip irrigation treatments (tape buried at 50 to 75mm at 2m spacings in a solid plant configuration and at 3m spacings in a single skip row configuration) with two furrow irrigated treatments (solid plant and single skip). The drip used was TSX 915-40-250. The row length for each treatment was 300m.
Averaged over four seasons the furrow irrigated solid cotton out-yielded solid drip irrigated cotton by 13%. The amount of irrigation water applied was 27% less with 1m drip compared to solid furrow on average and 16% less with skip drip compared to skip furrow.
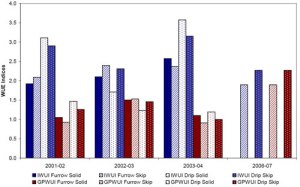
The IWUI is 27% higher for solid planted drip and 21% higher for skip row drip compared to the respective configurations for furrow irrigated cotton.
The GPWUI is 7% higher for solid planted drip compared to solid planted furrow cotton, and 14% higher for single skip drip compared with single skip furrow cotton.
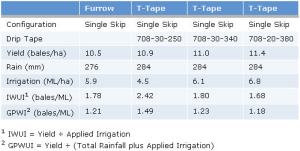
In 2004-05 three different T-Tape types were compared with furrow irrigated cotton grown in a single skip configuration. The results are summarised in Table 5.
In 2005-06 maize was sown on the demonstration site.
The drip irrigation demonstration in 2004-05 showed the effect of different drip tapes on crop performance. The highest yielding cotton was with the tape with the highest flow rate and closer emitter spacings (708-20-380). However this tape also had the highest irrigation application (6.8ML/ha compared to 5.9 ML/ha for furrow irrigation). The drip tape with the greatest IWUI and GPWUI was the 708-30-250 – 2.42 bales/ML and 1.49 bales/ML respectively (36% and 23% higher then the furrow irrigated cotton respectively).
‘Mungana’ drip irrigation demonstration
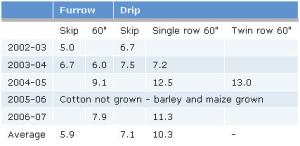
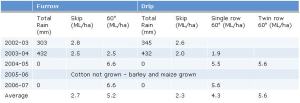
Drip irrigation demonstrations were established in cotton on a heavy black cracking clay in the 2002-03, 2003-04, 2004-05 and 2006-07 seasons. In 2005-06 no cotton was planted – the site was sown to barley and maize on this area following the 2004-05 cotton crop. The differing treatments in this demonstration are summarised in Table 6.
The results showed a 20% yield increase for skip drip over skip furrow cotton and a 34% yield increase for 60″ drip over 60″ furrow. There was 15% less water used by skip drip compared to skip furrow and 17% less water used by 60″ drip over 60″ furrow.
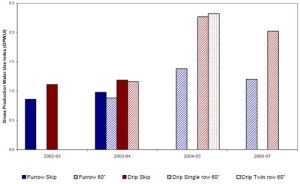
The IWUI is 42% higher for skip drip compared to skip furrow and 62% higher for 60″ drip compared to 60″ furrow. The GPWUI is 25% greater for skip drip compared to skip furrow and 61% higher for 60″ drip compared to 60″ furrow.
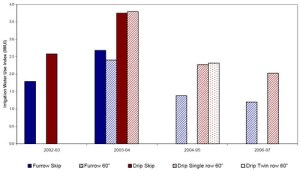
Figure 3 - Irrigation Water Use Indices (Yield ÷ Applied Irrigation) (bales/ML) for the five treatments on 'Mungana'
Conclusion
The demonstration sites showed a range of yield impacts of drip irrigation on cotton. The average yield decreased with the use of drip at the ‘Kensington Park’ site – although here drip out-yielded furrow irrigated cotton in the first year of installation. Yield for cotton increased with drip at the ‘Loch Eaton’ (a 10% yield increase on average over furrow irrigation with 1m drip) and ‘Mungana’ sites (where yield increases ranging from 20 to 34% for drip over furrow irrigation where recorded).
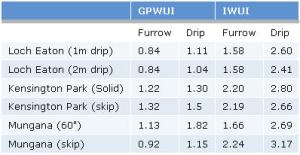
Table 9: Impact of drip irrigation on Water Use Efficiency Indices (bales/ML) or the three Darling Downs drip irrigation demonstrations
The average reduction in applied irrigation for drip irrigation over furrow irrigation ranged from 15 to 31% across the three demonstration sites.
The impacts of the yield increases and reduction in water use is captured in the WUE Indices reported in Table 9 which shows significant improvements in water use efficiency from the investment in drip irrigation. However, for an increase in profitability from the installation of drip the water savings must be significant enough to enable an expansion in cotton area and an increase in yield sufficient to increase profits over the existing furrow irrigation system.
It is also important that there is reliability in water supply from year to year to justify the significant capital investment. It is also important that best management practices in design, installation, management and maintenance of drip irrigation systems are followed – if not then profitable investment in these systems is unattainable.



0 Responses to “Drip irrigated cotton demonstrations”